September 17th, 2024

Urgent climate action vital for liveable future, warns IPCC

Feasible solutions for emission reduction and climate resilience available now

Urgent climate action vital for liveable future, warns IPCC

The Intergovernmental Panel on Climate Change (IPCC) has released a new report highlighting the urgent need for immediate and ambitious action to combat climate change, stating that viable options for reducing greenhouse gas emissions and adapting to climate change are available now. IPCC Chair Hoesung Lee emphasised that mainstreaming effective and equitable climate action can secure a liveable, sustainable future for all.

Continued Emission Increases Exacerbate Climate Crisis

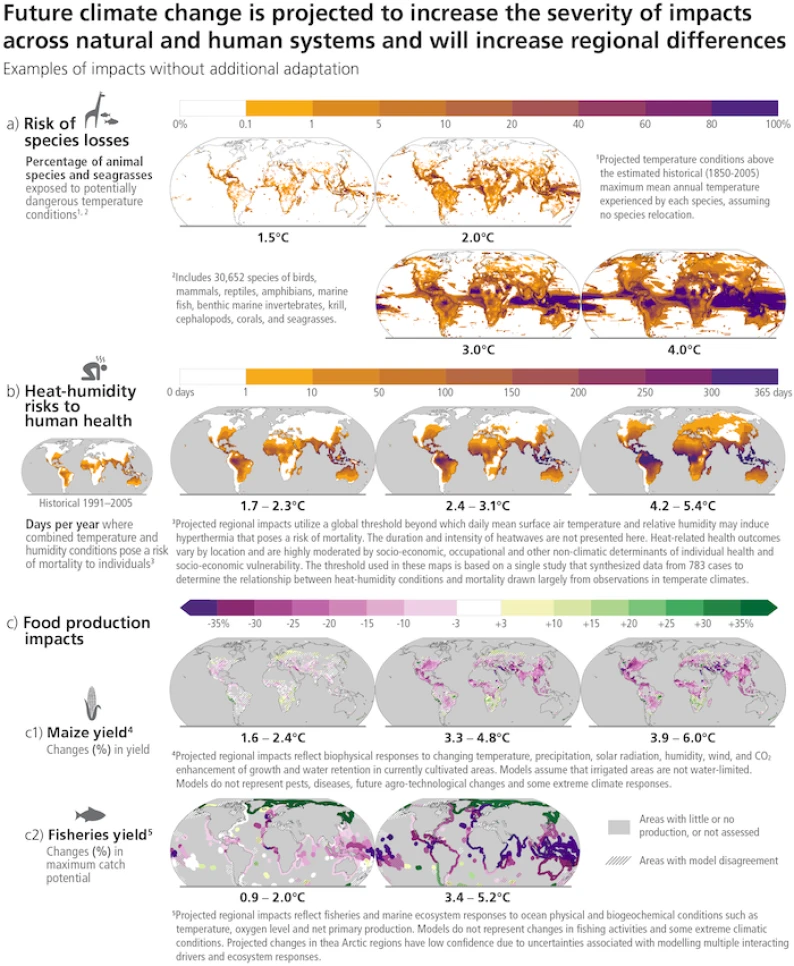
Five years after the IPCC outlined the unprecedented challenge of limiting global warming to 1.5°C, the situation has worsened due to continued emission increases. Over a century of fossil fuel use and unsustainable energy and land practices have led to a 1.1°C global temperature rise above pre-industrial levels, causing more frequent and intense extreme weather events with severe impacts on nature and people worldwide.

Projected changes of annual maximum daily temperature, annual mean total column soil moisture CMIPand annual maximum daily precipitation at global warming levels of 1.5°C, 2°C, 3°C, and 4°C relative to 1850–1900. Simulated (a) annual maximum temperature change (°C), (b) annual mean total column soil moisture (standard deviation), (c) annual maximum daily precipitation change (%). Changes correspond to CMIP6 multi-model median changes. In panels (b) and (c), large positive relative changes in dry regions may correspond to small absolute changes. In panel (b), the unit is the standard deviation of interannual variability in soil moisture during 1850–1900. Standard deviation is a widely used metric in characterising drought severity. A projected reduction in mean soil moisture by one standard deviation corresponds to soil moisture conditions typical of droughts that occurred about once every six years during 1850–1900.

Losses and Damages in Sharp Focus

The latest IPCC report draws attention to the losses and damages already experienced and those expected to continue, especially affecting the most vulnerable people and ecosystems. Aditi Mukherji, one of the report’s authors, highlighted that climate justice is crucial as those least responsible for climate change are disproportionately impacted.

Closing the Gap: Adaptation and Emission Reductions

To limit global warming to 1.5°C above pre-industrial levels, deep, rapid, and sustained emission reductions are needed across all sectors. Emissions must start decreasing immediately and be cut by almost half by 2030. Concurrently, accelerated adaptation measures are essential to bridge the gap between current adaptation efforts and what is needed.

Climate Resilient Development: The Way Forward

Climate resilient development, which integrates adaptation measures with emission reduction actions, is the solution. Examples include clean energy access, low-carbon electrification, and sustainable transportation. These measures offer wider benefits, such as improved health, air quality, employment opportunities, and equity. Implementing these solutions will become increasingly challenging as global temperatures rise.

Inclusivity and Local Solutions are Key

Effective climate action must be based on diverse values, worldviews, and knowledge systems, including scientific, Indigenous, and local knowledge. Prioritising climate risk reduction for low-income and marginalised communities can yield the greatest gains in wellbeing. However, accelerated climate action requires a significant increase in finance.

Enabling Sustainable Development through Policy and Investment

There is ample global capital to rapidly reduce emissions if barriers are minimised. Governments, investors, central banks, and financial regulators all have crucial roles to play in increasing climate investments. Tried and tested policy measures can be scaled up and applied more widely, with political commitment, coordinated policies, international cooperation, ecosystem stewardship, and inclusive governance all vital for effective and equitable climate action.

Interconnectedness: Climate, Ecosystems, and Society

Recognising the interconnectedness of climate, ecosystems, and society is essential. Effective and equitable conservation of 30-50% of Earth’s land, freshwater, and ocean areas will contribute to a healthy planet. Ambitious climate action in urban areas, changes in sectors such as food, electricity, transport, industry, buildings, and land-use, and understanding the consequences of overconsumption can reduce emissions and improve health and wellbeing.

Projected risks and impacts of climate change on natural and human systems at different global warming levels (GWLs) relative to 1850-1900 levels. Projected risks and impacts shown on the maps are based on outputs from different subsets of Earth system and impact models that were used to project each impact indicator without additional adaptation. WGII provides further assessment of the impacts on human and natural systems using these projections and additional lines of evidence. (a) Risks of species losses as indicated by the percentage of assessed species exposed to potentially dangerous temperature conditions, as defined by conditions beyond the estimated historical (1850-2005) maximum mean annual temperature experienced by each species, at GWLs of 1.5oC, 2oC,3oC and 4oC. Underpinning projections of temperature are from 21 Earth system models and do not consider extreme events impacting ecosystems such as the Arctic. (b) Risks to human health as indicated by the days per year of population exposure to hyperthermic conditions that pose a risk of mortality from surface air temperature and humidity conditions for historical period (1991-2005) and at GWLs of 1.7°C–2.3°C (mean = 1.9°C; 13 climate models), 2.4°C–3.1°C (2.7°C; 16 climate models) and 4.2°C–5.4°C (4.7°C; 15 climate models). Interquartile ranges of GWLs by 2081–2100 under RCP2.6, RCP4.5 and RCP8.5. The presented index is consistent with common features found in many indices included within WGI and WGII assessments (c) Impacts on food production: (c1) Changes in maize yield by 2080–2099 relative to 1986–2005 at projected GWLs of 1.6°C–2.4oC (2.0°C), 3.3°C–4.8oC (4.1°C) and 3.9°C–6.0oC (4.9°C). Median yield changes from an ensemble of 12 crop models, each driven by bias-adjusted outputs from 5 Earth system models, from the Agricultural Model Intercomparison and Improvement Project (AgMIP) and the Inter-Sectoral Impact Model Intercomparison Project (ISIMIP). Maps depict 2080–2099 compared to 1986–2005 for current growing regions (>10 ha), with the corresponding range of future global warming levels shown under SSP1-2.6, SSP3-7.0 and SSP5-8.5, respectively. Hatching indicates areas where <70% of the climate-crop model combinations agree on the sign of impact. (c2) Change in maximum fisheries catch potential by 2081–2099 relative to 1986–2005 at projected GWLs of 0.9°C–2.0°C (1.5°C) and 3.4°C–5.2°C (4.3°C). GWLs by 2081–2100 under RCP2.6 and RCP8.5. Hatching indicates where the two climate-fisheries models disagree in the direction of change. Large relative changes in low yielding regions may correspond to small absolute changes. Biodiversity and fisheries in Antarctica were not analysed due to data limitations. Food security is also affected by crop and fishery failures not presented here.